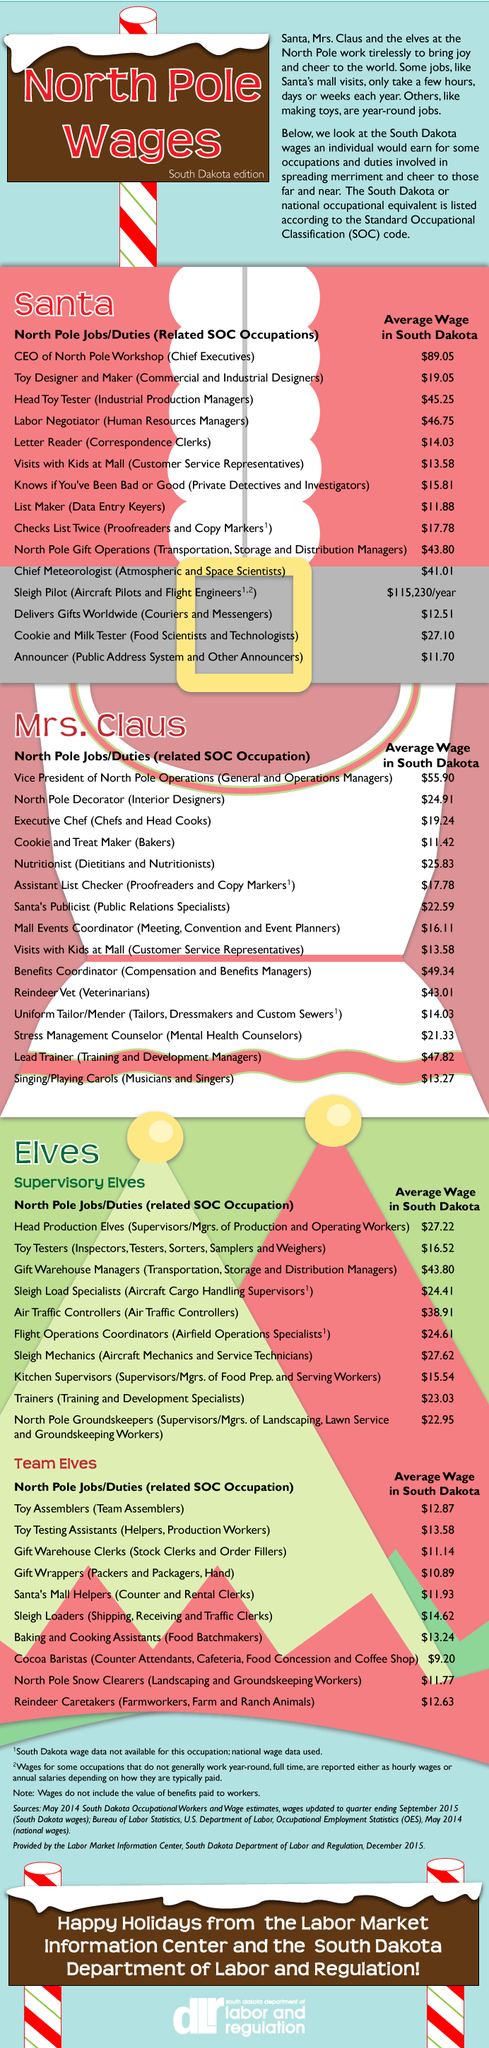
Your Department of Labor and Regulation tweets a cute infographic showing the South Dakota equivalent average wages for Santa’s helpers at the North Pole. Naturally, such South Dakota data get me thinking about how those wages would stack up against national wages.
The DLR uses a mishmash of 2014 and 2015 data. Let’s keep things clean and look just at May 2014 data for the jobs included in the DLR chart. (May 2014 appears to be the most recent wage data available from the Bureau of Labor Statistics.) Below is a table showing average hourly wages for every occupational category listed in the DLR Holiday 2015 infographic for which BLS offers both national and South Dakota data:
| Occupation | South Dakota | National | SD/US |
| Chief Executives | $86.22 | $86.88 | 99.24% |
| Commercial and Industrial Designers | 18.59 | 32.23 | 57.68% |
| Industrial Production Managers | 43.82 | 48.87 | 89.67% |
| Human Resources Managers | 45.26 | 54.88 | 82.47% |
| Correspondence Clerks | 13.66 | 17.42 | 78.42% |
| Customer Service Representatives | 13.22 | 16.29 | 81.15% |
| Data Entry Keyers | 11.58 | 14.48 | 79.97% |
| Transportation, Storage and Distribution Managers | 42.41 | 44.80 | 94.67% |
| Atmospheric and Space Scientists | 40.02 | 42.35 | 94.50% |
| Couriers and Messengers | 12.18 | 13.63 | 89.36% |
| Food Scientists and Technologists | 26.45 | 32.15 | 82.27% |
| Public Address System and Other Announcers | 11.42 | 18.20 | 62.75% |
| General and Operations Managers | 54.12 | 56.35 | 96.04% |
| Interior Designers | 24.31 | 26.37 | 92.19% |
| Chefs and Head Cooks | 18.74 | 22.06 | 84.95% |
| Bakers | 11.10 | 12.28 | 90.39% |
| Dietitians and Nutritionists | 25.21 | 27.62 | 91.27% |
| Public Relations Specialists | 22.05 | 30.79 | 71.61% |
| Meeting, Convention and Event Planners | 15.61 | 24.48 | 63.77% |
| Veterinarians | 41.98 | 47.23 | 88.88% |
| Mental Health Counselors | 20.82 | 21.15 | 98.44% |
| Musicians and Singers | 12.95 | 32.49 | 39.86% |
| Supervisors/Mgrs. of Production and Operating Workers | 26.47 | 28.39 | 93.24% |
| Inspectors, Testers, Sorters, Samplers and Weighers | 16.06 | 18.46 | 87.00% |
| Air Traffic Controllers | 37.81 | 57.11 | 66.21% |
| Aircraft Mechanics and Service Technicians | 26.88 | 28.29 | 95.02% |
| Supervisors/Mgrs. of Food Prep. and Serving Workers | 15.13 | 15.58 | 97.11% |
| Training and Development Specialists | 22.30 | 29.58 | 75.39% |
| Supervisors/Mgrs. of Landscaping, Lawn Service and Groundskeeping Workers | 22.35 | 22.13 | 100.99% |
| Team Assemblers | 12.51 | 14.78 | 84.64% |
| Helpers, Production Workers | 13.20 | 12.31 | 107.23% |
| Stock Clerks and Order Fillers | 10.85 | 12.20 | 88.93% |
| Packers and Packagers, Hand | 10.59 | 11.08 | 95.58% |
| Counter and Rental Clerks | 11.56 | 13.25 | 87.25% |
| Shipping, Receiving and Traffic Clerks | 14.23 | 15.27 | 93.19% |
| Food Batchmakers | 12.87 | 13.84 | 92.99% |
| Counter Attendants, Cafeteria, Food Concession and Coffee Shop | 8.96 | 9.53 | 94.02% |
| Landscaping and Groundskeeping Workers | 11.46 | 12.85 | 89.18% |
| Farmworkers, Farm and Ranch Animals | 12.32 | 12.10 | 101.82% |
Now we see why more musicians don’t hang around South Dakota.
Only three jobs out of these 38—landscaping/groundskeeping supervisors, farmworkers, and production workers—manage to offer average wages that beat the national average for their occupation. Five jobs—air traffic controllers, event planners, announcers, commercial and industrial designers, and musicians—earn less than 70% of the national average.
Mash these 38 jobs together, and South Dakota average wages are 86% of the national average. South Dakota’s cost of living in Q2 2014 was 100.8% of the national average. The Governor’s Office of Economic Development contends (per data updated September 2015) that South Dakota’s cost of living index is 87.6% of the national average. Current C2ER survey data says our Q3 2015 cost of living was 106.3% of the U.S. COL.
Of the three groups we are better than average I think the farmworkers would include the largest numbers of workers because we are largely an ag state. So does this mean that illegal immigrants are the recipients of our best wage advantage in the state? But then this states leadership never did care about their own homegrown workers wages instead of corporate profits.
Wow, according to the average for my category I am getting the wage equivalent of a lump of coal.
Musicians and singers, over 60% below the national average.
Ouch.
Am i blind? where are the teachers?
While it would suit you well, Bill, bard has always been a poor choice of occupation.
I sorted the list from highest percentage (of national wage comparison) to lowest looking for a theme. I don’t see one yet. Maybe a larger list of jobs would make that appear? Managers and specialty, highly educated jobs seem to fare well. Does anyone else see more rhyme or reason attached to value?
Average Registered Nursing salaries for job postings in South Dakota are 25% lower than average Registered Nursing salaries for job postings nationwide. The average salary ranks 48th among states in the country.
http://nursejournal.org/registered-nursing/rn-careers-salary-outlook/
Porter again you have proved your worth.Would you run against photo op for senate .
I fight bullies, Moses. That’s what I do. You do it.
Might be time to recognize the changes in demographics from the worker pool to Democratic Party registrations: South Dakota sucks. What brain cell with a bit of intelligence, a smattering of comprehensive education, a belief in the values of the Declaration of Independence, or a hope to rise above ignorant bigotry would choose to live in South Dakota? The salary schedules expresses its values.
Is the better solution to low salaries political in nature (join/vote Democratic) or organizing in a labor union?
Owen, BLS says that in May 2014, high school teachers, occupation code 25-2031, averaged $42,460 in South Dakota and $59,330. SD average is 71.6% of national.
Thanks Cory. I bet we’d improve these numbers if we got rid of Right to Work laws
O, one can download the full BLS occupation/wage spreadsheets for the US and for each state. The South Dakota spreadsheet lists annual mean wages for 584 occupations. The 61 of those occupations make more in South Dakota than nationwide. Across all professions, the average wage is South Dakota is on average 85.79% of the national average.
I contend we need both a political approach and an organized labor approach. Labor could make more progress if we removed legal barriers to union effectiveness. Curious: what’s been more effective in the past, political campaigning or union efforts for teachers?
Well Cory since pay for teachers is still last in the nation I’d say neither.
If I had to choose I’d say political campaigning. You’d think it would be union efforts but the union is largely ineffective.
Without the ability to strike the union has no leverage plus with Right to Work laws also let teachers not belong to the union but still benefit from the negotiations. Which I have a problem with with some teachers. SDEA does provide some protection against teachers being unfairly fired. But again they have to provide that protection to all teachers and not just the ones that belong to SDEA.
But, your calculations show that the cost of living in SoDak isn’t less than the nat’l average BUT the Governor says it’s 20% cheaper than the national average?
Beware French math and Grinches, young Mr. Lansing.
And a Merry Christmas to you, Ebrnezer Grooge.