South Dakota’s voter turnout in the 2026 midterm dropped below 50% for the first time in at least 60 years. 310,298 South Dakotans cast ballots this fall, 44,372 fewer voters than participated in the 2022 midterm general election. The number of registered voters increased over the last four years by 5.27%, but the number of voters who participated in the 2026 midterm general election decreased 12.51% from 2022.
This decrease in midterm voter turnout happened in every one of South Dakota’s 66 counties:
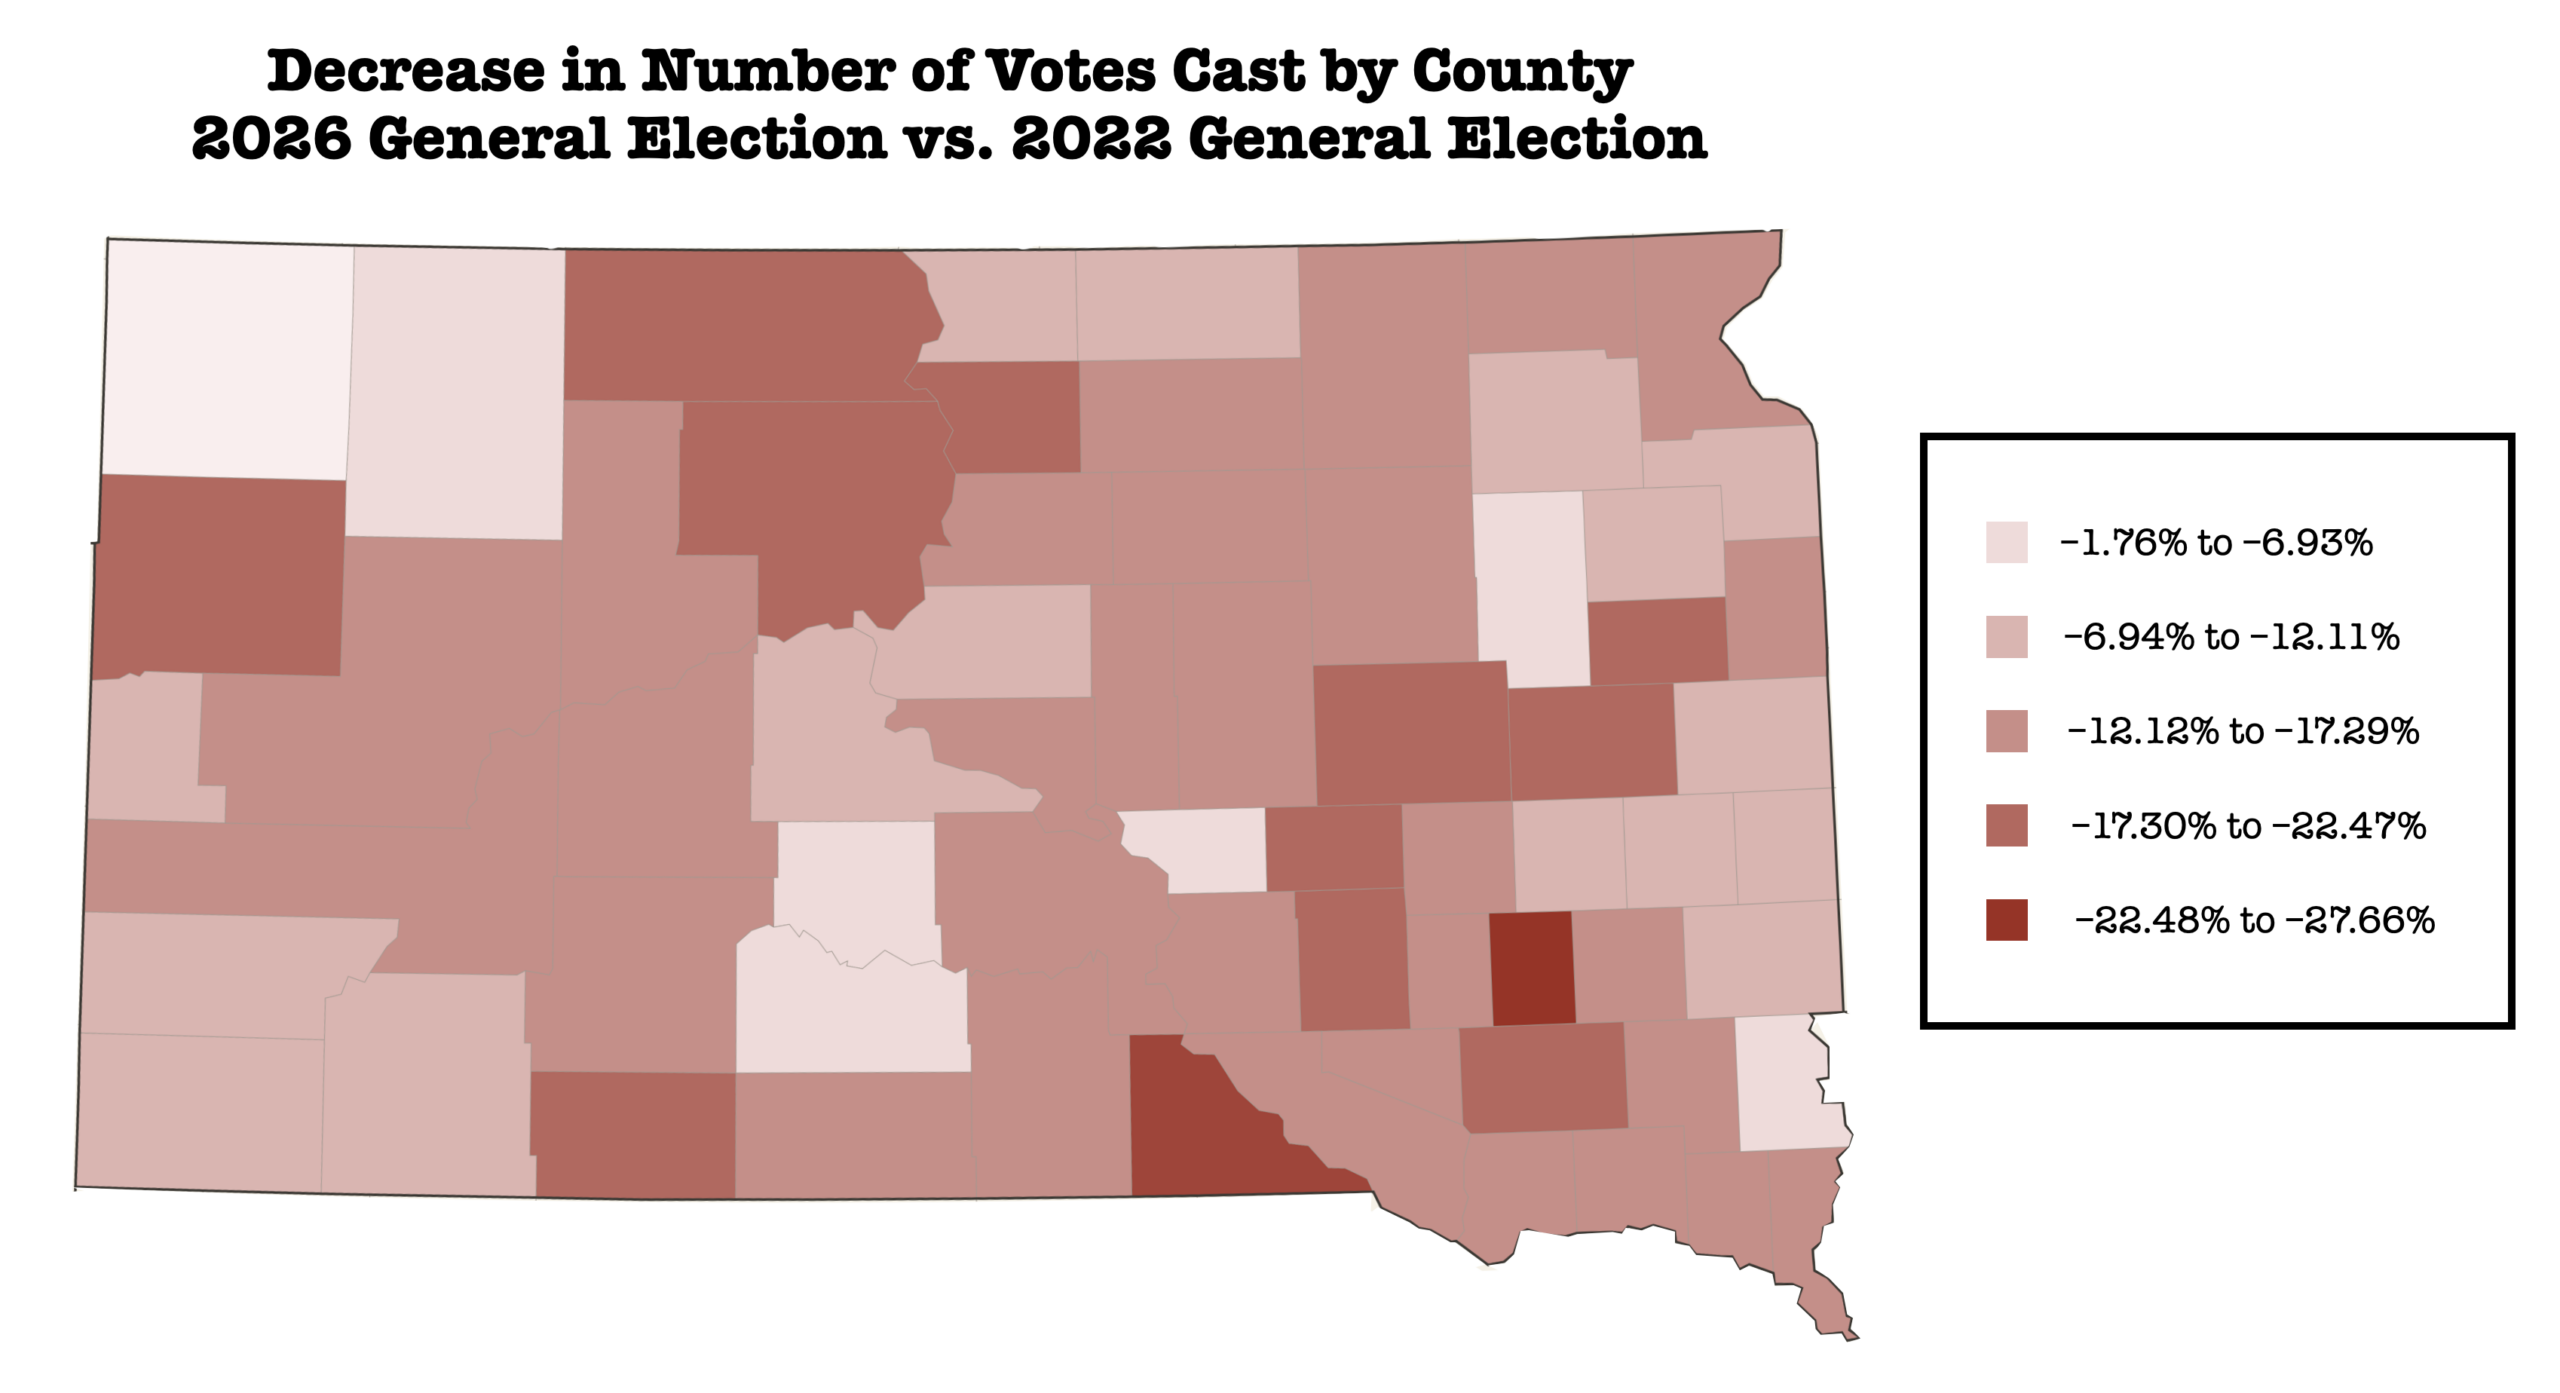
20 counties experienced declines in the number of registered voters from the 2022 general election to this year’s general, but in all but the two smallest of those counties, Buffalo and Jones, the decrease in the number of participating voters far outweighed the decrease in the number of registered voters. For instance, Brown County lost 718 registered voters between 2022 and 2026, the largest county decline in the state, but it saw 1,993 fewer voters at the polls this year versus the last midterm.
Five counties saw the number of participating voters this year versus 2022 decrease by more than 20%:
- Hanson: –27.7%
- Gregory: –23.0%
- Corson: –21.5%
- Aurora: –20.4%
- Walworth: –20.2%
Five counties managed to keep their midterm voter shrinkage below 6%:
- Buffalo: –5.7%
- Clark: –4.2%
- Jones: –3.6%
- Mellette: –2.1%
- Harding: –1.8%
My cursory statistical analysis finds no meaningful correlation between the varying rates of decline and the size of each county’s registered electorate, county margins for Trump in 2024, or the proportions of registered Republicans, Democrats, and independents in each county. South Dakota voters across the map were simply less interested in the candidates and ballot measures on their 2026 general election ballot than they were in the last midterm election.