The awful graph of the week comes from the Department of Revenue’s otherwise rock’em-sock’em first-of-its-kind statewide Tax Increment Financing Report. Check out this poorly proportioned representation of the value of new development in TIF districts on which property taxes go toward public infrastructure in those districts rather than the general needs of local schools, cities, and counties:
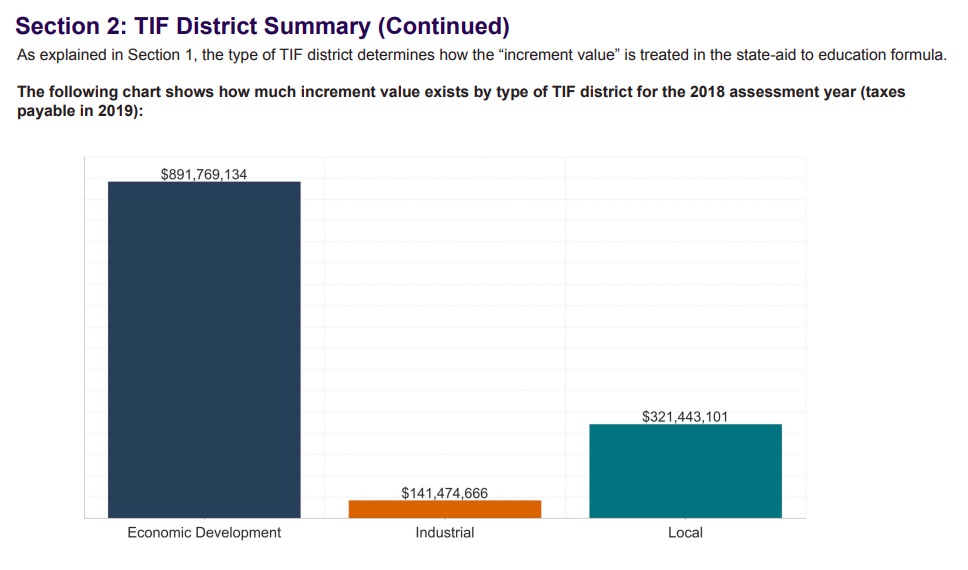
See that thin orange sliver of industrial TIF value? That $141 million should look like a bit less than half of the greenish local TIF value of $321 million and a not quite a sixth of the blue economic development TIF value of $892 million. Instead, DOR makes the industrial slice look like less than a fifth of the local chunk and barely a twentieth of the economic development value.
Evidently the graphics paster lopped off the first $100 million and failed to label the y-axis to show that omission. Here’s what the graph should look like:
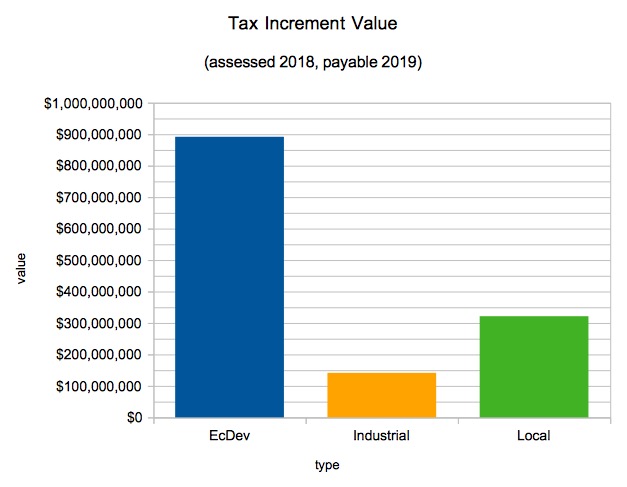
Basic bar chart rule: start your axis at zero. If you have some exceptional reason to start at another number, label the axis boldly to show that break from expectation and explain the resulting misproportion.
But don’t let that graphing error distract you from the big data provided by the report about tax revenue we’ve kept off the books because local governments have identified 331 instances—191 still being paid off—where South Dakota’s wages and business climate were just too weak to support residential, commercial, or industrial development.
I’m scrolling through Aberdeen’s 18 TIFs (the report doesn’t capture Aberdeen’s latest TIF, Jarrett Jones’s grand plan to build “Ringneck Ridge”—houses, businesses, and maybe a grocery store on U.S. 281 west of town, approved May 21) and all the TIFs listed elsewhere around the state. I’ll have some analysis on those numbers in an upcoming post… but I’m sure you’ll understand my slowness, since I’m absolutely riveted to Dakota War College, waiting with bated breath for Pat to write something, anything original and profound on his ballyhooed blog trip to Washington, D.C.
Could be the missing 100 nil is the crony capitalist’s share?