Here’s the weirdest little statistic I’ve been able to pull out of Tuesday’s primary results so far. Looking across the county-level results for the two big Republican primaries for Governor and U.S. House, I find the strongest correlation lies between the vote totals of gubernatorial nominee Kristi Noem and Congressional number-three Neal Tapio. Counties that went harder for Noem also tended to vote more for Tapio:
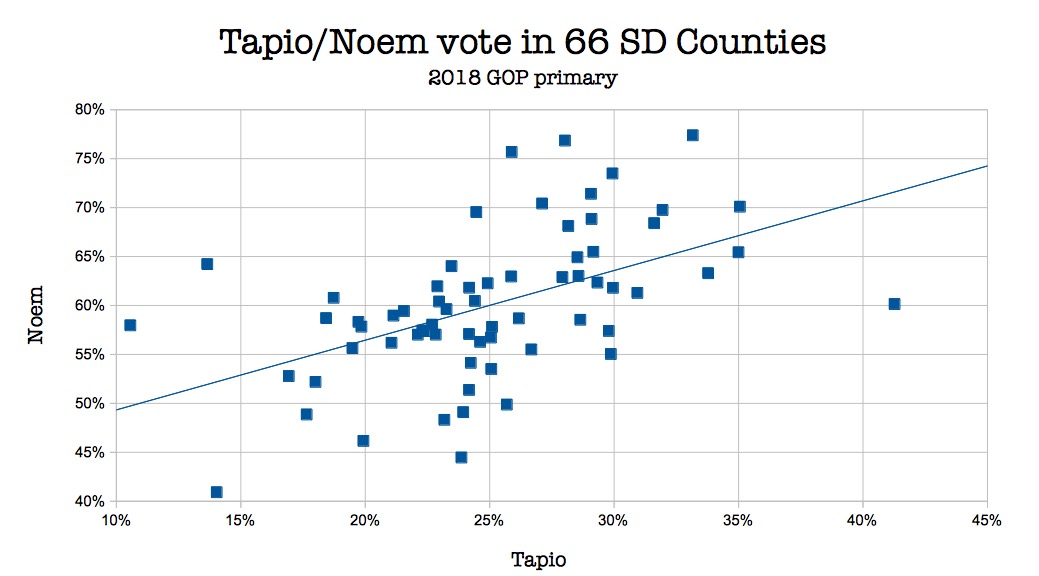
The correlation coefficient is 0.513, not bonkers-strong, but it’s there.
In the seven counties that Noem lost to Marty Jackley, Neal Tapio finished third. In six of the seven counties where Noem clobbered Jackley with over 70% of the vote, Tapio placed second, above Shantel Krebs.
I’m not sure what to make of that Noem/Tapio correlation. If there was any preference for a female candidate in the Governor’s race (and Noem has not been playing up that angle), it certainly didn’t spill over to benefit Shantel Krebs; it leaned strangely toward the misogynist but single (misogynist thus single?) Ward Cleaver who advertised that he’s “good-looking” (which I still refuse to believe: Neal Tapio does not project sex appeal). Combined with my Legislative primary data showing female candidates posting the same success rate as men in Tuesday’s vote, this correlation seems to show that gender politics was not a primary criterion on voters’ minds.
Technically a 60% from 6 out of 10 is not the same as a 60% from a 600 out of 1000 due to error bars. But I am not sure one would use sqrt(N) in a voting error calculation however.
Nevertheless, is this slope (i.e. the correlation) within a standard deviation of zero slope?
if you want to look further into the numbers check out the desrepency between total people who voted in the gov race, vs the house race, vs state legislative races. Some 40-50% of republicans did not vote in legislative races.
I’m just spitballing here, but would those counties also be the areas that gave Annette Bosworth the lion’s share of her votes? South DaCola linked to a Lee Stranahan segment on Russian sponsored Sputnik Radio. He and, I’m guessing the rest of Bosworth’s supporters, holds more than a little antipathy toward Jackley.
Excellent question, Kal Lis! SOS Krebs, bless her heart, has the 2014 primary results by county right here. I run them through my spreadsheet and find no big correlations among the 2014 GOP Senate primary county results and the 2018 GOP US House primary county results. But check out the correlations between Noem’s county results this year and the five GOP Senate candidates’ results in 2014:
Nelson: 0.455
Rounds: -0.227
Bosworth: 0.293
Ravnsborg: -0.087
Rhoden: -0.285
I wouldn’t bet the farm on any of these predictors, but the strongest correlation is between county-level preference for Stace Nelson in 2014 and Kristi Noem this year. Bosworth and Noem have a positive but weak correlation of about the same strength of the negative correlation between Rhoden and Noem. That’s really interesting, because Rhoden has been whispered as Noem’s running mate. Rhoden likes spending time with Noem; he was on her last-whirlwind primary tour bus. If these correlations have even marginal meaning, picking Rhoden as running mate might boost her margins in places that like him but had doubts about her on Primary Day.
I’m not sure using correlation between percentages is the best statistic, and particularly when you have the three people running in one race and two in another.
I think the oddest deal is that Mr. Tapio, the insanest candidate, win Oglala Lakota county even after he said he could have Trump end the reservation system.
Roger, just ignore Grudz. He’s either deliberately being an idiot or too dense to understand that the white ranchers are the ones eligible to vote in the GOP primary, not native people.
I’d do something ranking each county, then applying Spearman’s rank order correleation.
https://statistics.laerd.com/statistical-guides/spearmans-rank-order-correlation-statistical-guide.php
Debbo
I will ignore grudz, I recognized that comment as bait and ain’t gonna bite.
Ranking better than percentage? Good suggestion, Donald! Using OpenOffice, running Pearson on Noem’s county ranks:
Tapio: 0.560
Krebs: -0.315
Johnson: -0.186
A little stronger on Tapio and Krebs, a little weaker on Johnson.
Doesn’t Tapio represent the District 5 Senate seat in Watertown? Noem’s hometown is nearby Castlewood. Could the correlations be more geography than anything else?
Interesting hypothesis, Jimmy J! Looking at percentage of each county’s vote, Codington was Tapio’s 8th-best county and Noem’s 27th best.
Noem’s homebase Hamlin County made both candidates’ top ten: Noem’s 7th-best and Tapio’s 2nd best.
The other three top-tens where they intersected were Douglas (Armour, Corsica: Noem’s #1, Tapio’s #5) and Bennett (Martin: Noem’s #8, Tapio’s #6), and Sanborn (Woonsocket, Artesian: Noem’s #4, Tapio’s #10).
If we look at Hamlin, Codington, and the six counties that touch them, five were in the top half of rankings for both Tapio and Noem, while two were in Tapio’s and Noem’s worst quartile (Kingsbury: T-51, N-58; Brookings T-54, N-51).
The two counties Tapio won, Tripp and Oglala Lakota, are 9 counties away from Codington.
The 22 counties where Tapio beat Krebs (and when we reach for 20 second-place finishes, we are reaching) are 6 in the northeast (Clark, Codington, Hamlin, Deuel, Grant, Roberts), an 8-county cluster centered around Mitchell and Alexandria (Sibby and Stace!), five of the six West River counties bordering Nebraska (except Fall River), and then Custer, Buffalo, Hyde, and Walworth.
Tapio had some strength close to his claimed home, but his support did not show a neat pattern of falling off with distance from his rental on Lake Kampeska.
Looking just at the big picture, doesn’t seem weird to me. Tapio is a Mini-me to Trump and, without researching it, I’m willing to propose that Noem voted every time to follow the Trump spiral down in Congress. Our Ignore-the-corruption AG seemed more his own man. Unfortunately, it
seems to me that our excessively conservative citizens (as well as our abundance of excessively conservative voters) followed Noem and Tapio as a team, kind of like Trump and Pence. Or Laurel and Hardy.
Yeah, but the majority of Noem voters didn’t follow Tapio. Tapio got 23,980 votes; Noem got 57,437. At most, less than 42% of Noem’s voters also marked Tapio. The correlation between Noem and Tapio votes exists, but for poor Neal, it was outweighed by other factors.
Robin, would you say that Krebs showed as much willingness to follow the Trump spiral down in Congress as Tapio? If so, how did Tapio get a positive correlation with Noem while Krebs got a negative correlation?