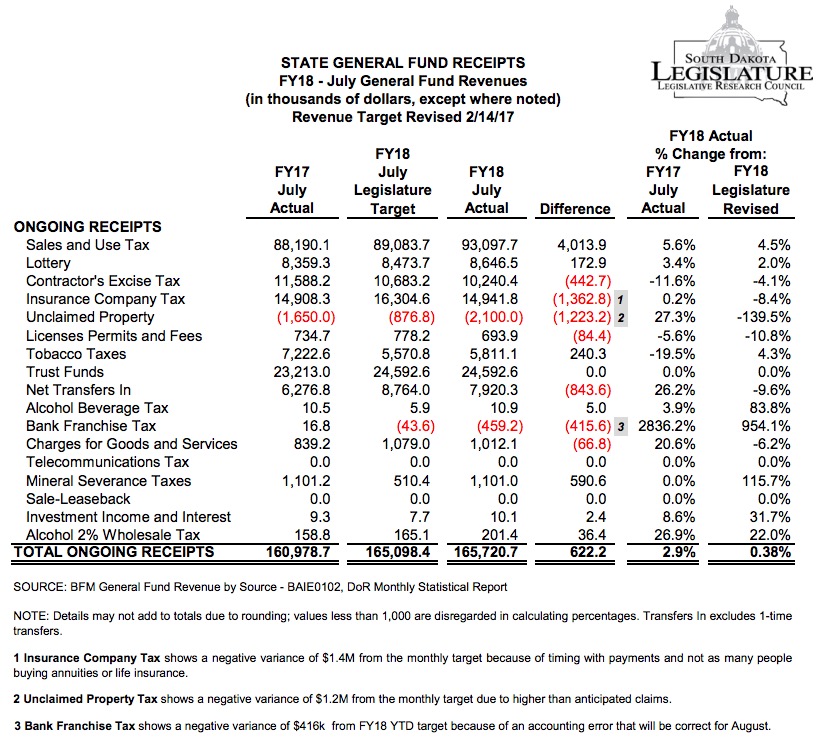
In good news (unless you’re a consistent Libertarian), South Dakota state government took in a little bit more money than expected in July. According to the first monthly general funds receipts report of the new fiscal year, South Dakota took in 0.38% more cash than the Legislature said was necessary and 2.9% more than it did last July:
The good fiscal news comes mostly from $93.1 million in sales tax, 4.5% more than the Legislature expected and 5.6% more than the July 2016 count. The $4.01 million in above-expectations sales tax was enough to erase all of the deficit categories—contractor’s excise tax, insurance company tax, unclaimed property, license permits and fees, net transfers in, charges for goods and services, and bank franchise tax. (The $416K bank franchise tax deficit was due to “an accounting error”—hee hee!)
We also picked up $1.1 million from mineral severance taxes, more than twice as much as we expected for the month. Someone must be digging up more oil and gold!

Not sure how they could come up with July numbers as Sales Tax reports and payments aren’t due until Aug. 20. What am I missing?
Thought the same. How can those numbers be available when they are not all collected? Perhaps wishful thinking is now the norm?
Oh! Good point, John and Jerry! I think the numbers reported above are the sales tax revenues that came into state coffers in July from June sales.
Dept of Revenue says gross sales plus use taxable items were down .22% in 6/17 compared to 6/16. Not sure how that would create 5.6% more revenues on that line. http://dor.sd.gov/Taxes/Business_Taxes/Statistics/2017/2017_State_Taxable_Sales_Comparison.aspx
Does that June report refer to returns filed in June, reflecting sales that took place in May?
Yes. Returns filed in July 2017 show an increase in sales and use items of 3.08% from the prior July, which is closer to the state’s 5.6% line, but still substantially below it. http://dor.sd.gov/Taxes/Business_Taxes/Statistics/2017/July/0717StateMjrGrpDiv.pdf
Do you think that we are somehow tilting the score to reflect more on what NOem had predicted regarding growth?
Nah, Jerry, they wouldn’t tilt the score that obviously. Besides, if they were going to tilt it, the first number to tilt would be the taxable sales, the more direct measure of GDP. John, I wonder what you and I are missing between taxable sales and tax receipts. Different reporting dates, perhaps?
Think I figured it out, Cory. The 5.6% is FY to FY change. The June to June change was 3.7%, consistent with the numbers I dug up. Mercer’s blog has a longer compilation that leads with the 5.6% number but scrolling down you can see the M to M comparison, data provided by SD Dashboard. https://bfm.sd.gov/dashboards/GECo_2_gfrev_201708.pdf#page=6
Bingo! There had to be a logical explanation. Thanks, John!
I don’t see 5.6 percent anywhere on Bob Mercer’s blog post regarding sales taxes. I see Mercer’s blog links to the BFM’s report, while Heidelberger’s blog uses the LRC’s report. One difference appears to be that BFM’s report excludes cost of administration for collecting sales taxes. LRC’s report doesn’t note that difference. — Bob Mercer
Bob Mercer, the top line of the first table on your link compares “Actual July 2017” to “Actual July 2018.” The “percent change” is “5.6” The confusion stems from naming a month and not just comparing FY 17 to FY 18. Scrolling down the link brings up the month-to-month change of “3.7”