Hey, here’s a happy economic fact! South Dakota’s filthy rich aren’t as far removed from the rest of us as the national 1% are!
According to the Economic Policy Institute’s new report on “The New Gilded Age,” the average income of the top 1% in 2015 nationwide was $1,316,985. The average income for everybody else in America was $50,107. That means the average rich guy is making 26.3 more than the average everyman (and remember, that “everyman” includes a lot of doctors, lawyers, and other local poobahs).
In South Dakota in 2015, the 1% averaged a mere $1,130,048, 14% less than the national average. The rest of us here in South Dakota averaged $50,107, 13% better than the national average. Our rich/regular ratio is thus only 20.0. Those numbers show that South Dakota’s wealth is a bit more spread around, with fewer people leaping way ahead of the rest of us.
The thresholds for counting as rich, stinking rich, and super-stinky-kiss-my-pinky rich are also lower in South Dakota:
| Income thresholds | SD | US | SD/US |
| Top 1% | $407,406 | $421,926 | 96.56% |
| Top 0.1% | $7,831,851 | $9,765,989 | 80.20% |
| Top 0.01% | $22,596,893 | $32,317,855 | 69.92% |
Apply these numbers to Aberdeen, and we can figure that there are 283 people making over $407K, 28 people making over $9.77 million, and two, maybe three Aberdonians clearing $22.6 million.
Notice also that the difference between the South Dakota wealthy-elite thresholds and the national thresholds gets bigger as we go up the ladder, suggesting that there are fewer opportunities to get obscenely rich in our fair state.
South Dakota has also seen somewhat better income growth and equality in that growth since the recession. From 2009 to 2015, overall South Dakota income grew 17.0%, while the national income growth rate was 14.6%. income grew fast than the national average for our 99-percenters and slower than the national average for our one-percenters. And over those seven years, South Dakota’s 1% claimed “only” 23.2% of total wage growth, while the national 1% claimed 41.8% of that growth. Both are inordinate shares, but South Dakota’s was less inordinate. (There’s your new t-shirt: “South Dakota: Less inordinately unequal!”)
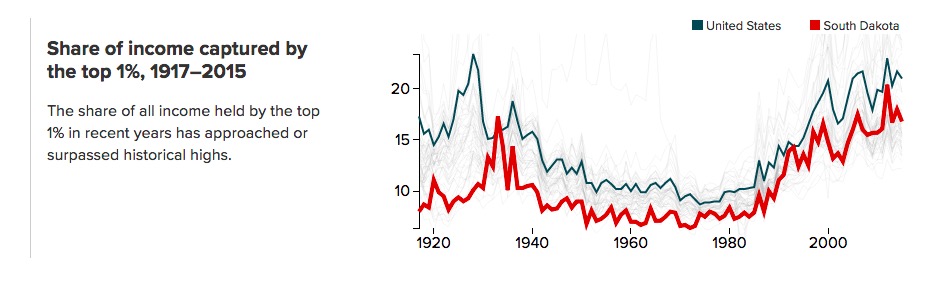
Overall, in 2015, South Dakota’s 1% earned 16.8% of all income in our state, versus a national average of 21.0%. One twist on that comparison: back in 1928, South Dakota’s 1% claimed 10.1% of South Dakota’s income, while the nation’s 1% claimed 23.4% of the nation’s income. So by that single metric, the nation’s 1% have actually seen their income dominance decrease a bit, while South Dakota’s 1% of increased their share. But 1928 was part of an income spike for the wealthy elites nationwide, a spike that didn’t hit South Dakota until the Depression:
The South Dakota counties with the least income inequality—here, the lowest ratio between average 1% income and average for everyone else— are Oglala Lakota, Faulk, Bon Homme, Bennett, and Corson. Ten of our counties have 1% average income-to-99% average income ratios less than 10. The most unequal counties by this metric are Union, Marshall, Stanley, Lincoln, and Clay. Only Union and Marshall are higher than the national average of 26.3. Eight counties have 1%/99% average income ratios higher than 20.
| Rank (by top-to-bottom ratio) | County | Average income of the top 1% | Average income of the bottom 99% | Top-to-bottom ratio |
| 3052 | Oglala Lakota | $203,645 | $33,540 | 6.1 |
| 2933 | Faulk | $409,425 | $50,131 | 8.2 |
| 2898 | Bon Homme | $382,420 | $45,448 | 8.4 |
| 2843 | Bennett | $289,173 | $33,178 | 8.7 |
| 2820 | Corson | $287,719 | $32,542 | 8.8 |
| 2788 | McPherson | $370,450 | $41,135 | 9 |
| 2717 | Todd | $240,070 | $25,753 | 9.3 |
| 2636 | Hutchinson | $469,418 | $48,655 | 9.6 |
| 2615 | Dewey | $471,412 | $48,438 | 9.7 |
| 2605 | Ziebach | $169,806 | $17,367 | 9.8 |
| 2525 | Hanson | $931,097 | $92,472 | 10.1 |
| 2466 | Jackson | $315,968 | $30,753 | 10.3 |
| 2468 | Meade | $533,229 | $51,916 | 10.3 |
| 2275 | Day | $446,500 | $40,907 | 10.9 |
| 2134 | Turner | $553,832 | $48,898 | 11.3 |
| 2046 | Fall River | $490,365 | $42,527 | 11.5 |
| 2071 | Roberts | $507,351 | $44,217 | 11.5 |
| 2004 | Deuel | $537,368 | $46,147 | 11.6 |
| 2000 | Perkins | $514,496 | $44,155 | 11.7 |
| 1849 | Hughes | $731,735 | $60,283 | 12.1 |
| 1853 | Haakon | $604,155 | $49,831 | 12.1 |
| 1862 | Jerauld | $513,417 | $42,424 | 12.1 |
| 1776 | Aurora | $514,885 | $41,757 | 12.3 |
| 1789 | Kingsbury | $643,989 | $52,326 | 12.3 |
| 1791 | Lake | $831,864 | $67,597 | 12.3 |
| 1746 | Miner | $588,219 | $47,431 | 12.4 |
| 1716 | Butte | $524,970 | $42,026 | 12.5 |
| 1690 | Grant | $627,751 | $49,990 | 12.6 |
| 1581 | Charles Mix | $582,819 | $45,068 | 12.9 |
| 1521 | Moody | $634,570 | $48,406 | 13.1 |
| 1494 | Sanborn | $562,566 | $42,588 | 13.2 |
| 1497 | Brule | $649,761 | $49,229 | 13.2 |
| 1371 | Spink | $721,037 | $52,845 | 13.6 |
| 1189 | Douglas | $652,273 | $45,319 | 14.4 |
| 1153 | Hand | $754,351 | $51,850 | 14.5 |
| 1009 | Codington | $782,367 | $51,257 | 15.3 |
| 954 | Lyman | $666,157 | $42,765 | 15.6 |
| 895 | Beadle | $733,144 | $46,073 | 15.9 |
| 878 | Hamlin | $906,481 | $56,645 | 16 |
| 850 | Davison | $782,607 | $48,473 | 16.1 |
| 829 | Brookings | $860,958 | $52,984 | 16.2 |
| 848 | Yankton | $858,609 | $53,139 | 16.2 |
| 814 | Walworth | $784,046 | $47,883 | 16.4 |
| 718 | Lawrence | $909,532 | $53,548 | 17 |
| 686 | Edmunds | $971,644 | $56,584 | 17.2 |
| 656 | Tripp | $687,649 | $39,339 | 17.5 |
| 637 | Potter | $1,023,195 | $58,169 | 17.6 |
| 615 | Pennington | $1,031,280 | $58,007 | 17.8 |
| 579 | McCook | $979,078 | $54,134 | 18.1 |
| 489 | Clark | $894,849 | $46,914 | 19.1 |
| 477 | Gregory | $698,276 | $36,366 | 19.2 |
| 337 | Custer | $1,036,264 | $49,702 | 20.8 |
| 233 | Brown | $1,275,634 | $55,999 | 22.8 |
| 228 | Minnehaha | $1,451,921 | $63,173 | 23 |
| 213 | Clay | $965,910 | $41,262 | 23.4 |
| 216 | Lincoln | $2,258,670 | $96,551 | 23.4 |
| 159 | Stanley | $1,740,622 | $67,907 | 25.6 |
| 90 | Marshall | $1,529,232 | $51,248 | 29.8 |
| 18 | Union | $4,835,625 | $92,752 | 52.1 |
This rose-tree is not made to bear
The violet blue, nor lily fair,
Nor the sweet mignionet:
And if this tree were discontent,
Or wished to change its natural bent,
It all in vain would fret.
And should it fret, you would suppose
It ne’er had seen its own red rose,
Nor after gentle shower
Had ever smelled its rose’s scent,
Or it could ne’er be discontent
With its own pretty flower.
Like such a blind and senseless tree
As I’ve imagined this to be,
All envious persons are:
With care and culture all may find
Some pretty flower in their own mind,
Some talent that is rare.~ Mary Lamb
There once was a farmer from Lead,
Who swallowed a packet of seeds.
It soon came to pass,
He was covered with grass,
But has all the tomatoes he needs.
https://www.vox.com/2018/7/23/17602746/tax-cuts-work-bloomberg-wages
In the second quarter real wages are down over 1% and down over 9% since 2006.
Taxcuts for the koch bros benefited the koch bros and there is another taxcut in the wingnut pipeline for fall.
Interesting. My ex-wife has done some research in the area of why ancient societies with high inequality displaced societies with relative equality. Migration seems to be a possible answer.
http://journals.plos.org/plosone/article?id=10.1371/journal.pone.0024683
Maybe worth noting that these look like average household incomes to me, not just individual incomes.
Well, shoot. That all makes this retired person kick me out the door poor. No pinkies involved!
I bet all know all three of Mr. H’s richer Aberdeenite friends, but it is indeed good to be reaffirmed that South Dakota has more regular Joes than the rest of the world. Here, we like hard work, common sense, and regular Joes.*
*disclaimer: grudznick has no good friends named “Joe”, but several named “Bob” and “Bill.”
So if the average 1% income in Hand County, where I grew up, is $754,000, then there may be people making more and people making less, correct?
Who the hell is making a $mil+/- in Hand County for pete’s sake?!? The mind reels.
Wait. I know of at least one family farm corporation with lots of acres and lots of Noemish subsidies. I suppose that all counts as income, even though the only way they got it was via correctly completed paperwork.
Where’s Hyde and Buffalo counties?
Debbo, Hyde is Nick Nemec’s country. Buffalo County is to the south, at Fort Thompson on the River.
Yes, given that average for Hand County, there are almost surely people making more than that. With a population of 3,431, we’re talking 34 people. How much spread there is among those 34 people is anyone’s guess; there could be a cluster of relatively successful farmers all earning $850K, or there could be just a couple of mega industrialists making $2M and skewing the average upward.
No Cory. What I meant was where are Hyde and Buffalo on the list. I don’t see them. This time it was me that was unclear. Sorry. 😆
Is this family income? An average of single people and married filing jointly? What about married filing singly how would that be averaged? If the average person not family in the 99 of Lake County is making 67k that’s pretty darn incredible doesn’t seem more likely that’s family income. Then what do they do with married filing single add the two together before creating the average?
Dang! I copied straight from the source—I wonder if they left off data?
Sure enough—I find only 59 counties listed. EPI left off the seven of the least populous counties: Jones, Harding, Sully, Hyde, Campbell, Buffalo, and Mellette. (Interesting—they included Haakon, which has fewer people than Mellette.)
Hap, the methodology is a complicated read, but it appears they are figuring household income.
1928, here we come! Just in time for 1929!! yikes
“American economic inequality hit a historic peak in 1928, when the country’s richest 1 percent captured nearly a quarter of the nation’s total income. But now, in thirty American metro areas and five whole states, the 1 percent has broken that previous record — and in some cases has doubled it.
Economists Estelle Sommeiller and Mark Price released a paper last week through the Economic Policy Institute titled “The new gilded age: Income inequality in the U.S. by state, metropolitan area, and county.” Their research concludes that, on average, the income of American’s 1 percent is twenty-six times higher than the average of the bottom 99 percent.” https://jacobinmag.com/2018/07/income-inequality-super-rich-economic-policy-institute
I would say that it looks like an iceberg dead ahead, but they are melting fast.
Yikes, indeed. 😨