Patrick Anderson puts together a really interesting report on patterns of population decline and growth in South Dakota.
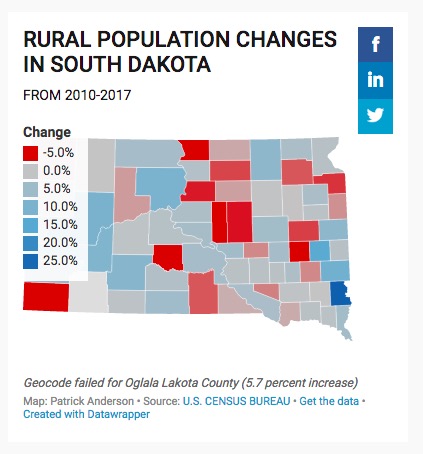
From 2010 to 2017, while South Dakota as a whole saw 6.8% population growth, 27 counties lost population while 39 grew. The only county with a population greater than 10,000 that saw a decline was Butte County, which lost just five residents between 2010 and 2017. Of the nine counties that beat the statewide growth rate, seven (Lincoln, Lake, Minnehaha, Meade, Pennington, Brown, and Brookings) started with populations over 10,000 (the two exceptions: Jackson and Dewey). In general, the big get bigger faster, while the small struggle to keep up.
Because of that big-bigger/small-smaller phenomenon, the scope of population shrinkage looks bigger on the map than it is in headcount. The 22 net loss counties posted a decline of 2,747 residents. The net gain in Brown County alone fell just 100 new residents short of washing out all those red/pink county declines. The 37 growing counties netted 58,216 new residents. Eight counties—Minnehaha, Lincoln, Pennington, Brown, Meade, Brookings, Lake, and Lawrence—accounted for over 91% of the net population growth in the state. South Dakota is decisively growing, and the new residents are decisively clustering in a few inviting places.
This clustering means that legislative districts will become more concentrated in our “urban” centers (and in an entire state that still feels like a small town, I feel compelled to put “urban” in quote marks). In 2010, strictly by population, our three biggest counties—Minnehaha, Pennington, and Meade—were entitled to 13.6 out of 35 seats in the Senate. Based on the 2010–2017 growth rates for each county, the 2020 population data on which the next Legislative map will be drawn would entitle those three counties to 14.6 Senate seats. On an idealized Legislative map, the 2010 population numbers would give our seven largest counties a voting majority in the Senate and our fourteen largest counties a voting supermajority (24 seats, two thirds of the Senate). In 2020, that ideal power will shift to just the six largest counties (Codington drops out—ha ha, Lee!) for simple majority and thirteen (Clay falls out) for supermajority.
It looks like District 23 is going to have to grow in size again. I am sure there is an inventive way to gerrymander Cory into our district.
Oh, Spencer, not that I like to think of myself as that important, but I’ll be watching for a return of the 2001 gerrymander to put me in your district. What say you and I run for Senate against each other? Or get Charlie to run against me—it would be great fun!
Without regard to partisan interests, Brown County is already over-gerrymandered, split among three districts instead of the 1.6 districts that population and minimal geographical disruption say is proper. We could hit a sweet spot by drawing one line through Brown County that would divide our 2020 population into 18,880 people on one side and 21,490 on the other. Connect the smaller side to McPherson and Edmunds to form a new District 23; connect the larger side to Clark to form a new District 3. Where would that line be? One mile north of Highway 12 (8th Avenue North here in town)? Maybe the railroad tracks?
How are they calculating growth? As PO box numbers and people registering their PO as residence?
I cannot read it ve4y good from iPhone
T., in my view, urban clusters are another reason rural areas feel on the short end of things. How much money do the urban clusters get for the use Walmart as your physical address or Mailbox services, seems like schools and government funding are based on P.O. physical addresses for census purposes.
Jerry thanks
I can’t find a way to see the western edge of the map. What should I do?
I think life is only going to become more difficult for rural folks, unless SDGOP has a sudden attack of compassion. I can’t see that coming. The RNC sure doesn’t have any.
Debbo, I couldn’t get that legend to move off Lawrence, Butte, and Harding counties, either. Designer’s tech error!
T, the Census counts residential address, where people usually live and sleep, not their P.O. box. Thus, we should not expect the RVers to all be counted in Minnehaha, Pennington, and Hanson counties.
This is called MAUP – the Modifiable Area Unit Problem. The President is apparently unaware of this effect, as he urges everyone that visits the Oval to marvel at his red map as a stamp of legitimacy.