The Department of Public Safety’s Crash Analysis Tool breaks down accidents by county. As we’d expect, where there are more people, there are more crashes:
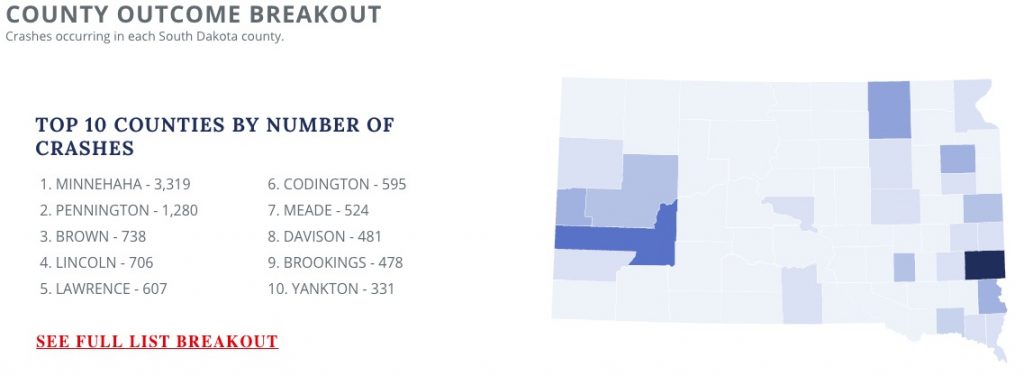
Notice that Lawrence and Meade jump over some more populous counties, perhaps due to their curvy strips of I-90, tricky Black Hills roads, and Sturgis Rally traffic.
Also standing out on that map is Spink County, which ranks 28th in population, 23rd in registered vehicles, but 13th in motor vehicle crashes. Spink County, whose major towns are Redfield, Mellette and Tulare, has just a bit more than a third of the population of Beadle County, whose biggest towns are Huron, Wolsey, and Wessington, yet Spink County racked up 235 crashes in 2017 while Beadle counted only 182.
Spink and Beadle both have two major U.S. highways: 281 crosses U.S. 212 in Redfield and U.S. 14 west of Huron. Since 48% more crashes happen on city streets than on US and state highways, I would think Huron’s urban jungle would boost Beadle’s figures over Spink’s. But there sits Spink with 29% more crashes than Beadle.
Looking at crashes with respect to the number of vehicles registered in each county can give us some idea of which counties are running the most spectacular demolition derbies. The Department of Revenue’s latest registration totals online are for 2016. I leave out trailers, snowmobiles, and boats since they aren’t doing much highway crashing. I also leave out recreational vehicles, since our tax-dodging friends who live in mailboxes in Madison and Alexandria aren’t here on our highways most of the year requiring us to dodge them.
| Crash Rank | County | Crashes 2017 | registered cars, trucks, SUVs, vans, motorcycles, ATVs, mopeds, and commercial vehicles 2016 | wrecks/1000 registered | over/under state average |
| 1 | Minnehaha | 3319 | 187679 | 17.7 | 20.68% |
| 2 | Pennington | 1280 | 131892 | 9.7 | -33.77% |
| 3 | Brown | 738 | 42699 | 17.3 | 17.94% |
| 4 | Lincoln | 706 | 56739 | 12.4 | -15.09% |
| 5 | Lawrence | 607 | 34322 | 17.7 | 20.68% |
| 6 | Codington | 595 | 32858 | 18.1 | 23.57% |
| 7 | Meade | 524 | 32338 | 16.2 | 10.57% |
| 8 | Davison | 481 | 23687 | 20.3 | 38.57% |
| 9 | Brookings | 478 | 32178 | 14.9 | 1.37% |
| 10 | Yankton | 331 | 25398 | 13.0 | -11.07% |
| 11 | Butte | 268 | 13184 | 20.3 | 38.71% |
| 12 | Custer | 260 | 13093 | 19.9 | 35.51% |
| 13 | Spink | 235 | 9005 | 26.1 | 78.08% |
| 14 | Union | 221 | 21124 | 10.5 | -28.61% |
| 15 | Roberts | 218 | 11829 | 18.4 | 25.76% |
| 16 | Hughes | 216 | 19035 | 11.3 | -22.57% |
| 17 | Clay | 204 | 17681 | 11.5 | -21.27% |
| 18 | Moody | 200 | 8843 | 22.6 | 54.33% |
| 19 | Lake | 197 | 17478 | 11.3 | -23.09% |
| 20 | Hamlin | 189 | 7912 | 23.9 | 63.01% |
| 21 | Beadle | 182 | 21634 | 8.4 | -42.59% |
| 22 | Mccook | 178 | 8010 | 22.2 | 51.64% |
| 23 | Tripp | 149 | 7514 | 19.8 | 35.32% |
| 24 | Lyman | 143 | 4417 | 32.4 | 120.92% |
| 25 | Kingsbury | 134 | 8499 | 15.8 | 7.59% |
| 26 | Turner | 128 | 11740 | 10.9 | -25.60% |
| 27 | Deuel | 121 | 6671 | 18.1 | 23.77% |
| 28 | Fall River | 119 | 10037 | 11.9 | -19.10% |
| 29 | Charles Mix | 112 | 9919 | 11.3 | -22.95% |
| 30 | Clark | 107 | 5472 | 19.6 | 33.44% |
| 31 | Jackson | 106 | 2986 | 35.5 | 142.24% |
| 32 | Aurora | 101 | 4208 | 24.0 | 63.79% |
| 32 | Hutchinson | 101 | 9837 | 10.3 | -29.94% |
| 34 | Stanley | 89 | 4362 | 20.4 | 39.23% |
| 35 | Brule | 88 | 6967 | 12.6 | -13.81% |
| 35 | Miner | 88 | 3644 | 24.1 | 64.79% |
| 37 | Edmunds | 87 | 6247 | 13.9 | -4.97% |
| 38 | Hand | 84 | 5079 | 16.5 | 12.86% |
| 39 | Grant | 82 | 9935 | 8.3 | -43.68% |
| 40 | Marshall | 78 | 6194 | 12.6 | -14.07% |
| 41 | Faulk | 76 | 3144 | 24.2 | 64.95% |
| 42 | Day | 75 | 8231 | 9.1 | -37.82% |
| 43 | Bon Homme | 73 | 8732 | 8.4 | -42.95% |
| 44 | Jones | 70 | 1849 | 37.9 | 158.34% |
| 45 | Oglala Lakota | 63 | 3629 | 17.4 | 18.46% |
| 46 | Hanson | 62 | 5767 | 10.8 | -26.64% |
| 47 | Walworth | 59 | 7041 | 8.4 | -42.82% |
| 48 | Sanborn | 58 | 3580 | 16.2 | 10.55% |
| 49 | Potter | 51 | 4021 | 12.7 | -13.45% |
| 50 | Perkins | 48 | 4699 | 10.2 | -30.29% |
| 50 | Jerauld | 48 | 3060 | 15.7 | 7.04% |
| 52 | McPherson | 38 | 3542 | 10.7 | -26.79% |
| 53 | Corson | 33 | 3896 | 8.5 | -42.20% |
| 54 | Sully | 32 | 2672 | 12.0 | -18.28% |
| 54 | Dewey | 32 | 4738 | 6.8 | -53.91% |
| 56 | Campbell | 31 | 2921 | 10.6 | -27.58% |
| 57 | Bennett | 30 | 3074 | 9.8 | -33.40% |
| 58 | Harding | 29 | 2134 | 13.6 | -7.27% |
| 59 | Buffalo | 25 | 1339 | 18.7 | 27.41% |
| 60 | Douglas | 24 | 4613 | 5.2 | -64.50% |
| 61 | Ziebach | 21 | 2246 | 9.3 | -36.20% |
| 62 | Gregory | 18 | 7025 | 2.6 | -82.52% |
| 63 | Mellette | 13 | 1795 | 7.2 | -50.58% |
| 64 | Haakon | 10 | 2920 | 3.4 | -76.63% |
| 65 | Hyde | 9 | 2268 | 4.0 | -72.92% |
| 66 | Todd | 2 | 3232 | 0.6 | -95.78% |
| State Total | 14574 | 994514 | 14.7 |
The counties with the most wrecks per 1,000 registered vehicles are Jones, Jackson, and Lyman, the three least-populous counties on I-90. The next three wreckiest counties are Spink, Faulk, and Miner, which touch neither I-90 nor I-29.
Among our biggest counties, Davison, Codington, Lawrence, Minnehaha, and Brown have notably more wrecks per thousand vehicles than the state average. Brookings is just a hair above average, while Clay is notably below average, suggesting Coyotes make better drivers than Jackrabbits!
Among safer busy places are Yankton and Lincoln counties, which beat the state average by 11% and 15%, respectively. Clay, Hughes, Lake, and Union beat the state average by more than 20%. The safest driving among big counties is found in Pennington (34% below the state average) and Beadle (43% lower).
Statewide, it appears to be safest to drive in Mellette, Dewey, Douglas, Hyde, Haakon, Gregory, and Todd counties, all of which in 2017 had crash-per-thousand-vehicle rates that were less than 50% of the statewide average. Good job keeping your eyes on the road, White River, Timber Lake, Highmore, Philip, Burke, and Mission!
It is impossible to say whether the drivers in any of these crashes are Coyotes or Jackrabbits from the information provided…either in Clay/Brookings or throughout the state.
But it is certainly of interest to reduce crash numbers in communities with the highest total number of crashes and the highest rate of crashes per unit population.
Wait until electric vehicles are the thing. Gas guzzlers create more horsepower and makes one want to see how fast you can go before you run out of gas.
Electric vehicles go slower and people are more interested in how far they can go between charges. Slower means less wrecks and deaths and lower insurance rates.
Electric vehicles seem to have more torque available from the get-go, so that isn’t necessarily the case. And sometimes there are issues after wrecks with electric cars due to the batteries.
But if you pay more for the vehicle, one tends to be more careful with it. Heck, you can spend more than $60K for a truck with all the bells and whistles.
True on the lack of Coyote/Jackrabbit-specific data, Robert. Your comment also gets me thinking about a misalignment in my data: the crash data show where the accidents happened, but the registration data show where cars are registered. Brookings County and Clay County have a lot of cars driving on their roads that are registered in other counties.
So imagine all other conditions were equal—weather, road repair, signage, driver care, deer population, alcohol consumption, anything we can think of that would affect crash rates. Brookings and Clay counties would have more cars registered in other counties on their roads, proportionally, than most other counties (save, perhaps, hubs like Minnehaha, Pennington, and Brown). Wouldn’t we then expect Brookings and Clay to show higher crash rates per 1,000 registered vehicles, since for every 1,000 locally registered cars, there’d be 300–400 student cars registered back home?
That’s why I’m tempted to say, at the very least, that large concentrations of Division I college drivers appear not to be driving higher crash rates.
But then look at our other major college towns. Lawrence and Brown are more dangerous, Lake is less dangerous. I won’t blame the Brown crashes on NSU students; my impression is that all sorts of people in this town are risky drivers. Remember, in Aberdeen, red is a suggestion. :-O
Really digging into those factors sounds like a good thesis topic for a civil engineering student :^).
I’d love to read that thesis!
Those are the guys and gals that tend to do traffic studies, so I wouldn’t be surprised if a similar thesis already exists somewhere….but the best fit could be with older data in a different state.