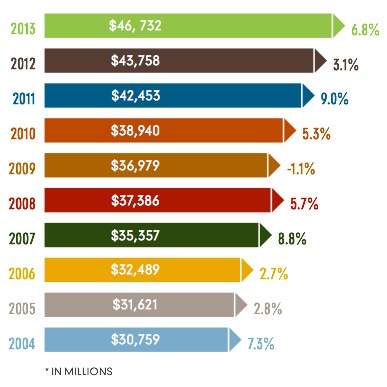
Mr. Ehrisman noticed this weekend the 2014 Annual Report from the Governor’s Office of Economic Development. Among the juicy morsels presented is this chart showing the relatively healthy growth of South Dakota’s gross domestic product from 2004 to 2013:

Boy, keep that up, and we’re darn near China!
Gross domestic product is the wealth we produce each year. If we’re producing more wealth, and if we’re taxing and spending properly, we ought to be able to enjoy proportionally more public goods and services, like education. So let’s compare average South Dakota teacher salaries (as reported by the state Department of Education) with our GDP growth (note: GOED reports GDP by calendar year, while DOE reports teacher salaries for fiscal/school years; here I align the 2004 GDP with the 2005 fiscal year figures, since FY2005 started July 1, 2004):
| Fiscal Year | Avg Teacher Salary | Gross Domestic Product (millions) | ATS chg | GDP chg |
| FY2004 | $33,236 | $30,333 | ||
| FY2005 | $34,039 | $30,759 | 2.42% | 7.30% |
| FY2006 | $34,673 | $31,621 | 1.86% | 2.80% |
| FY2007 | $35,378 | $32,489 | 2.03% | 2.75% |
| FY2008 | $36,697 | $35,357 | 3.73% | 8.83% |
| FY2009 | $37,917 | $37,386 | 3.32% | 5.74% |
| FY2010 | $38,836 | $36,979 | 2.42% | -1.09% |
| FY2011 | $39,253 | $38,940 | 1.07% | 5.30% |
| FY2012 | $38,807 | $42,453 | -1.14% | 9.02% |
| FY2013 | $39,018 | $43,758 | 0.54% | 3.07% |
| FY2014 | $40,023 | $46,732 | 2.58% | 6.80% |
In every year but one, South Dakota becomes wealthier at a faster rate than its teachers.
Or look at those numbers this way: if we multiply the average teacher salary by the number of certified teachers on the job (9,031 in FY2044; 9,338 in FY2014), we find that in FY2004, South Dakota was willing to spend 1.00% of its wealth to pay teachers. Teachers slice of the GDP pie slowly shrank to 0.94% by FY2011, plunged to 0.83% in Governor Dennis Daugaard’s first austerity budget in FY2012, and in FY2014 bottomed out at 0.80%
As South Dakota has gotten 55% richer, we have reduced the GDP-relative value of our teachers 20%. Add that to the binder for the Blue Ribbon Task Force.
GDP (GSP for the states) is a flawed method of judging economic growth. Since government spending is a key component of the GDP calculation is it no wonder that South Dakota’s GSP has increased 46% since state spending has increased 52% during the same time frame?
Hey Don, I’m just working with the numbers that your Republicans say are important and putting them in context.
Curious: are you decrying GDP just to argue with me? If so, that’s foolish, because I would agree that GDP is not inherently good. Are you saying South Dakota hasn’t actually increased its wealth over the last decade? If so, that’s unrealistic. Or are you actually supporting my thesis by noting that state government spending has gone up while the proportion of our wealth paid to teachers has gone down?
and the goobernor’s office is off its collective rocker and estimates by a factor of-???!
John Tsitrian properly notes the disconnect between purportedly strong GDP growth and the weak sales tax collections that undershot the Governor’s December projections. Where’s the beef?
As I’m sure my friend Grudz will soon be saying, raises can be funded only for the “good” teachers, and their incomes might substantially rise. Might. My response, and others here too, is to ask how to effectively identify the “good” teachers and the bad.
A writer in today’s Strib has described a way that I can wholly support. Mr. Steve Watson lists Five Steps to Teacher Excellence. I’m serious when I say this objective measurement will satisfy both Grudz and teachers. Click on this link:
http://www.startribune.com/opinion/commentaries/296649421.html