It didn’t look like any Blue Wave happened in South Dakota last year. We Democrats didn’t win any statewide seats or any more Legislative seats, and our voter registration is sliding again.
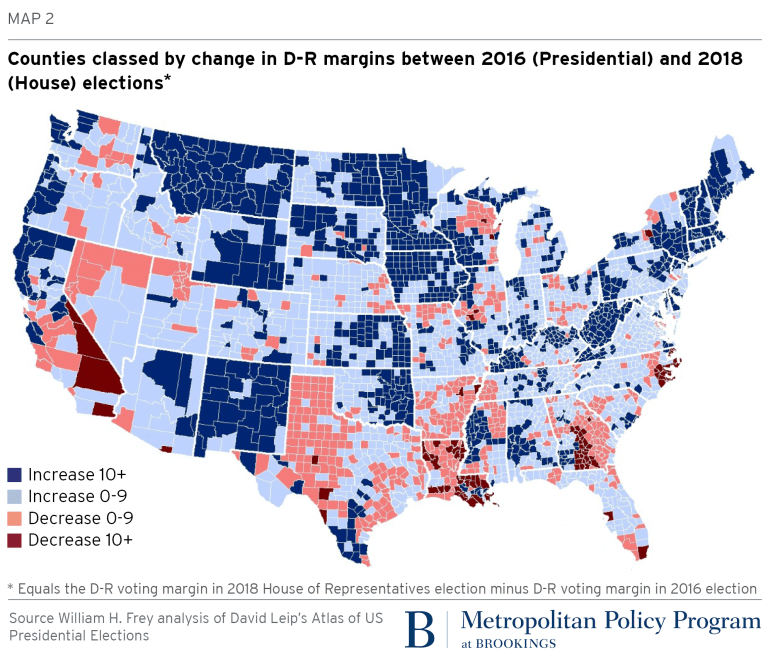
But Democrats nationwide enjoyed a Blue Wave, and a new analysis from the Brookings Institute says that even South Dakota was part of it. Sure, we’re still part of the big red rural bloc that keeps voting against fact and self-interest by electing hypocritical Trumpists:

But visually dominant red counties make up only 40% of the national electorate. 60% of Americans live in counties that went blue in 2018. And maybe more importantly for us optimists, Democrats have momentum in even more places. 83% of Americans live in counties where Democrats gained support in 2018 compared to 2016
Democrat Tim Bjorkman narrowed the GOP–Dem margin in 63 of our 66 counties. Dusty Johnson expanded the GOP margin in only his home counties of Davison and Hughes and on Pine Ridge in Oglala Lakota County (where he drew 336 votes compared to Trump’s 241, while Bjorkman drew 2,473 votes compared to Clinton’s 2,504).
So even in most of South Dakota, Democrats narrowed the gap between themselves and Republicans. There was a Blue Wave; it’s just that the Republican tidewall is so high here it was hard to notice. We’ve got a way to go before turning that gap into wins, but at least we have momentum!
When it is mentioned that, “Democrat Tim Bjorkman narrowed the GOP-Dem margin in 63 of our 66 counties:” Are you not referring in relation to Hillary and not Hawks? Because Hawks received 36% of the vote in ’16, while Bjorkman received 35% of the vote in ’18. Or is there something here, that I am missing. It seems to me that a truer comparison would be Paula versus Tim and not Tim versus Hillary.
I also note, that many of the bluer counties are in northwest SD and isn’t that because of Billy’s strength there as a credible west river farm and rancher and not so much because of a greater identity with Democratic politics?
The thing that really concerns me about ’18 is, that while Billy and Randy got 48 and 45 percent of the vote respectfully, Tim and all of the constitutional candidates where in the 35 to 38 percentile range, and we had no gains in the legislature.
In fact, if it had not been for the efforts of LEAD in Minnehaha and former Rep. Mike Clark’s awful comment about race, we would have actually lost 3 seats in ’18 in the state legislature.
JKC shows his astute sense of data with his points. Yes, Brookings’s comparison of Hillary 2016 to Bjorkman 2018 ignores the opportunity to compare House apples to House apples. It also should perhaps factor in the higher turnout of a Presidential election year.
However, Noem drew over twice as many votes as Trump in Oglala Lakota County in 2016 against Hawks. Bjorkman drew 111 more votes in 2018 in Oglala County than Hawks did in 2016. So if we used Dem-over-GOP margin in US House races in both years as our metric, Oglala Lakota would shift into the blue-trending category:
2016 Clinton – Trump = 2,263
2016 Hawks – Noem = 1,848
2018 Bjorkman – Johnson = 2,137
Sorry Cory. Comparisons don’t matter, votes do. Close doesn’t count except in hand-grenades, horesshoes and nuclear weapons.
We need more votes than the republic party candidates.
Surely (hope springs eternal) voters in this state will see with which party their interests lie (probably not).
Buckobear, believe me, I’m as disappointed that the blue wave didn’t rise high enough here for anyone to surf. But our next party chair (who, I hope, is reading this blog) may recognize in the numbers Brookings identifies an up-trend on which to build toward the outcome you cite, the outcome that really matters.
Notice, too, that SDDP chair candidate John Cunningham’s plan includes at least a few elections of getting closer before actually taking over the Legislature.
It’s clear how the Midwest is turning blue again. (I classify Midwest as Minnesota to Ohio.) Frantic Flaccid Fool has lost it, as long as the voting machines are square.
West Virginia looks awfully blue and I wonder how close NorDakota is to blue? The entire east side is blue.
That map looks very hopeful, other than the dimwitted South and a few other states. I can see the pluses for the Coyote state.
I disagree with the headline here. The national blue wave was entirely absent in South Dakota. The SDDP failed to lay groundwork to bring the national blue wave here. We continue to hemorrhage Democratic voters, and the state party is seemingly nonexistent. Billie Sutton’s strong run was due to who he is, not anything the party did. Remind me. How many state party conventions did we have to have last year because of the ineptitude of leadership? Both ideas and competence seem to be lacking.