Last updated on 2018-09-23
Megan Raposa gets the funny-smart tweet of the week for her observation on Regental PR:
I can tell which S.D. universities saw enrollment growth based on which PR people called to follow up on press releases.
— Megan Raposa (@mlraposa) September 20, 2017
Yes, when growth is good and shrinkage is shame, we can’t expect the Regents or the campuses to headline full story on campus enrollment. Their press release about higher fall enrollment this year is all spinnage about gains at DSU and USD keeping the systemwide gain at 0.36% for the year. We get no data up front about the shrinkage that must have happened at the other four campuses to keep enrollment practically steady across the Regental system. Here’s the line graph from the SDBOR Dashboard for all six campuses:
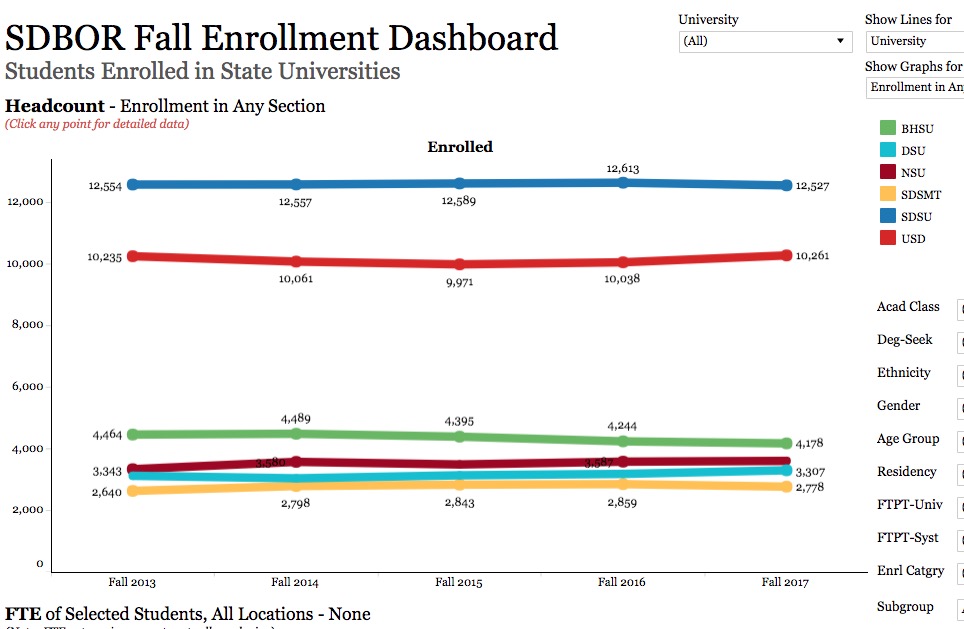
According to that chart, Northern ticked up a bit, too, but SDSU, BHSU, and Mines each went down. Oh well.
Permit me to do PR’s job and suggest a better lead for the story. Instead of trying to squeeze eternal-growth lemonade out of those lemony flatlines, why not move the long-term charts from the bottom of the Regental presser to the top and offer this assessment: South Dakota’s public universities have managed to maintain the record levels of enrollment achieved in the post-Recession boom for seven straight years!
That spin would never occur to typical PR people who grow up imbibing the business model of grow or die and ignoring the possibility that another definition of unbounded growth is cancer. But I would suggest that being able to maintain enrollment levels originally driven by an economic downturn in an economy chugging along with trivial unemployment figures (at least among the non-reservation population) is an achievement worth headlining.
South Dakota Public University System
Full-Time Equivalent Enrollment 1997-2017
| Fall Term | System | % Change |
| 1997 | 21,714 | |
| 1998 | 21,917 | 0.93% |
| 1999 | 21,606 | -1.42% |
| 2000 | 21,616 | 0.04% |
| 2001 | 22,339 | 3.35% |
| 2002 | 23,008 | 3.00% |
| 2003 | 23,605 | 2.59% |
| 2004 | 23,534 | -0.30% |
| 2005 | 24,089 | 2.36% |
| 2006 | 24,144 | 0.23% |
| 2007 | 24,512 | 1.52% |
| 2008 | 24,926 | 1.69% |
| 2009 | 25,468 | 2.17% |
| 2010 | 26,625 | 4.54% |
| 2011 | 26,720 | 0.35% |
| 2012 | 26,468 | –0.94% |
| 2013 | 26,782 | 1.18% |
| 2014 | 26,737 | –0.17% |
| 2015 | 26,684 | –0.20% |
| 2016 | 26,600 | -0.32% |
| 2017 | 26,634 | 0.13% |
Much more important than growth is retention and matriculation.