The Governor’s Office of Economic Development offers us more fun with numbers with their new and improved Real Wage Calculator. This nifty little tool, touted in GOED’s 2014 Annual Report, tells you how far your salary will stretch in locales all across the country compared with your after-tax purchasing power here in South Dakota.
The National Education Association just released its latest assessment of national teacher salaries and other education statistics. (Yes, we’re still last.) It’s mash-up time!
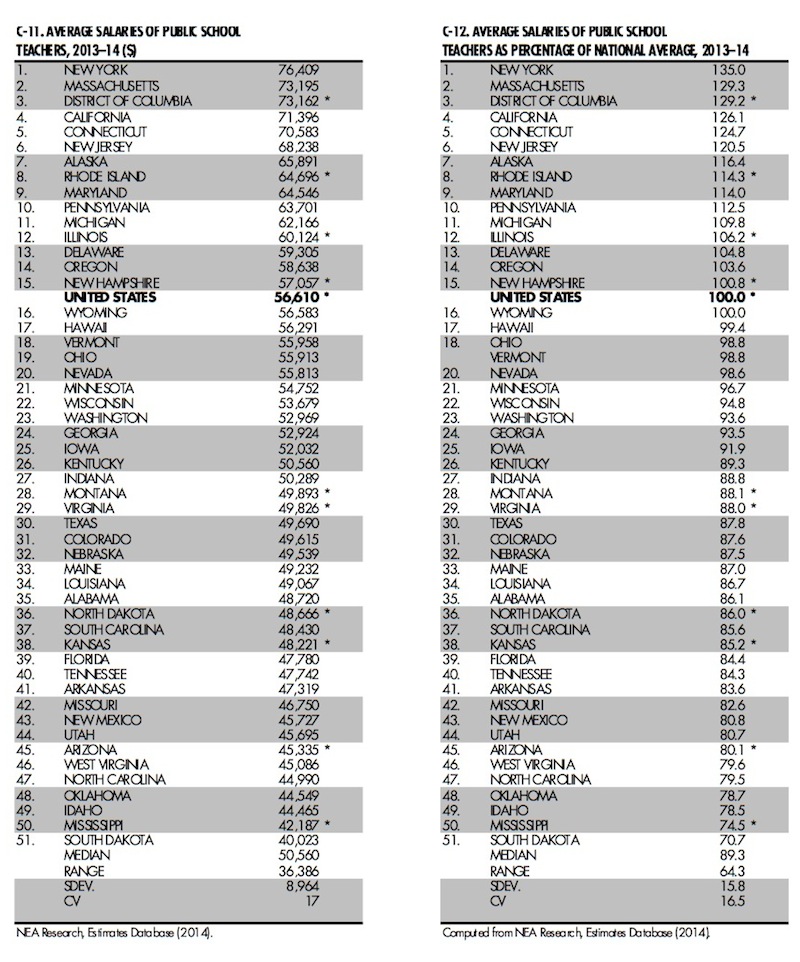
NEA reports the following teacher salaries by state for the 2013–2014 school year:
Punch those salaries into GOED’s Real Wage Calculator, and how much purchasing power do teachers in non-metro South Dakota, North Dakota, and Minnesota have?

Let me spare you some screen shots and do a full regional comparison of the NEA’s posted average teaching salaries with the after-tax purchasing power GOED says those salaries would produce in each state’s rural areas and in each state’s largest metro:
| State | avg teacher salary | non-metro after-tax purchasing power | biggest metro after-tax purchasing power |
| SD | 40,023 | 39,454 | 35,305 |
| ND | 48,666 | 44,808 | 41,549 |
| MN | 54,752 | 47,323 | 39,513 |
| IA | 52,032 | 46,252 | 41,602 |
| NE | 49,539 | 44,719 | 40,166 |
| WY | 56,583 | 46,641 | 46,399 |
| MT | 49,893 | 40,691 | 39,498 |
On straight salary, South Dakota teachers earn $11,888 less each year than the surrounding six-state average. On purchasing power averaged across all neighboring states, non-metro teachers give up $5,618 each year to teach in South Dakota; metro teachers give up $6,150. Multiply that out over 30 years in teaching, and a South Dakota teacher gives up a whole house.
File this post as Exhibit #1 in the Blue Ribbon Task Force on Teachers and Students docket on South Dakota’s teacher shortage.
Update 13:14 CDT: I have updated figures in the chart for Iowa, Nebraska, Wyoming, and Montana and revised the averages given in the penultimate paragraph.
To be fair, you can’t put a price tag on the respect and gratitude teachers get from the legislature and the Governor…wait…what?!?
Ok Grud. Let your whinning begin
Not only are teachers getting the stink end of the stick, we all are. The Democrats propose to change that http://blog.seattlepi.com/seattlepolitics/2015/03/23/murray-democrats-move-toward-proposing-12-an-hour-minimum-wage/
More money for workers equates to more money for educators. We must have the workforce that is trained and educated to fulfill the demands of the future. We cannot progress with an uneducated workforce. Ford has recently retooled their assembly lines for the new F-150 class of trucks. A serious amount of work is done with robots, but they also increased their human workforce by about 1,000 well educated technicians to work in conjunction with the robotics. Pretty cool. If we are gonna be a real power in the world, we must be an educated one.
I was experimenting with the calculator and just looking at non-metro SD, when I put $30,000 for a SD wage, the purchasing power is $30,153. I guess I would like to know the definition of ‘purchasing power.’ In fact, it seems like any salary less than $32,500 has a ‘purchasing power’ greater than the salary. I would like to see their formula and have someone explain how they are doing the calculations.
Dr. Math, I suspect GOED is trying to say that in South Dakota, your “real wage” isn’t the actual dollar amount your employer hands you but that dollar figure multiplied by some cost-of-living adjustment. I don’t know what national baseline Eide Bailly programmed into the RWC, but such a seemingly odd output says that, if we equalized all local cost of living, the non-metro South Dakota worker is going to be able to buy as much stuff after taxes as the non-metro Minnesotan who makes $32,570.
Of course, living in Minnesota, I also get better roads, parks, and schools, which aren’t figured in the amount of stuff I can buy with my purchasing power.
I read where the difference between state’s buying power was due to state income taxes which SD does not have. Wyoming and Nevada in your chart don’t have them either. So it would appear to me that the difference in purchasing power between those three states has to be lower wages paid in SD.