Speaking of GDP, I glanced at this chart from the St. Louis Fed showing South Dakota’s annual gross domestic product from 1997 through 2024:
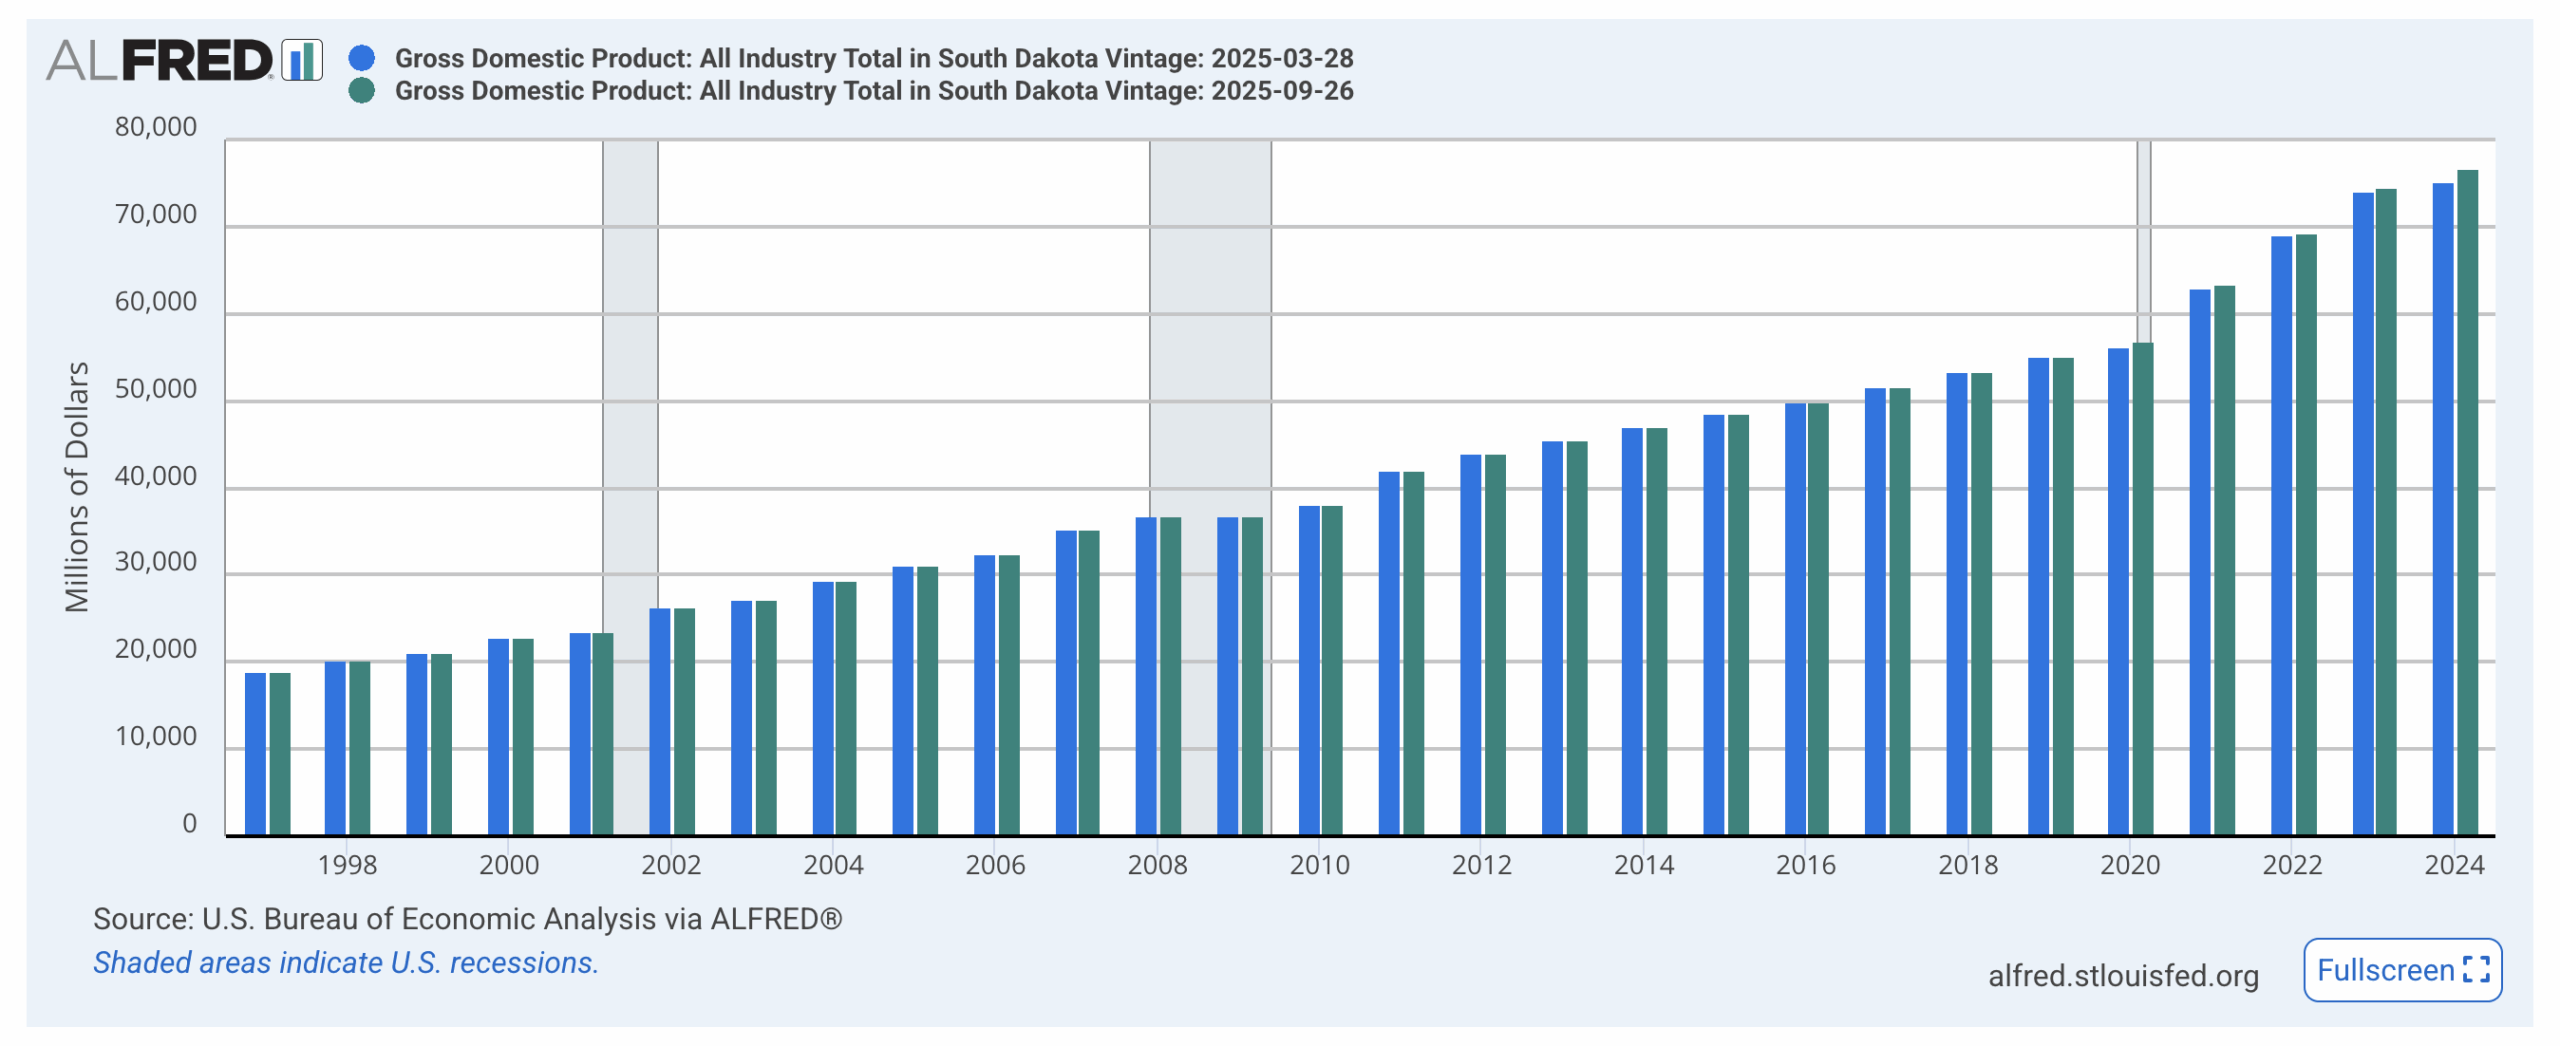
Notice that big uptick in the bars after the Trump/covid recession? Consider:
- Average annual SD GDP growth from 1997 through 2020: 4.90%
- Average annual SD GDP growth from 2021 through 2024: 7.85%
- Average annual SD GDP growth from 2017 through 2020: 3.34%
- Average annual SD GDP growth from 2017 through 2019: 3.45%
- Average annual SD GDP growth from 1997 through 2016: 5.38%
If I were doing Larry Rhoden math, I’d say South Dakota’s rate of economic growth under President Biden was “like six times or seven times” bigger than the historical average. But unlike Larry, I’m not into baseless misinformation. The annual rate of GDP growth during President Biden’s Administration was only 1.6 times that of average annual GDP growth in the preceding 24 years.
South Dakota’s economic output grew 2.35 times faster under President Biden than it did during Trump’s first term. Even before covid, annual SD GDP growth under Trump never exceeded 3.56%, well below the 5.38% annual average in the preceding 20 years.
Gosh Cory, you’ve got to keep a lid on this. The man who beat Donald Trump needs to be taken down even farther. It’s the known way to move up under Trump. EVERBODY knows how to play Don. Defile then praise, defile then praise. It’s the New American way.
So the man who filed bankruptcy six times cannot run the economy of a nation (but REALLY want to)?
Note that a recent interview with Moody’s puts SD as one of the 22 states listed as either “in a recession” or very near one.
In all fairness to Larry Rhoden, this can be blamed on his ability to connect the dots. He thought the question was “How many times have you been to drunk to govern”? His answer was “Like 8 ot 10 Times”, which was clearly a fib as he knows perfectly well, it is way more than that.
Now for real fibs, wait until Dirty Johnson gets the nod to be governor
I retired from teaching in 2014. I then started caregiving for a private company, at minimum wage. In 2021, I was making $10 an hour and in October received a $5 an hour raise. It was from the covid money and it’s the largest wage percentage wise that I’ve ever gotten.
People I know and work for are all hurting more financially than during covid. I think we are closer to a recession when people use up their savings, cash in IRAs, pick up extra shifts, cook more from scratch with cheap ingredients, sell and buy used items, sit in lines in their cars for hours for Feeding South Dakota boxes of food, and go to church for the lunch after service.
Our women’s shelter is used a great deal and homeless people are living in empty houses.
Ms. VM, that is exciting news. It is a very admirable occupation you take on. Is your $5 raise still in place, and if the money from the Covids is all gone now how is your employer continuing to pay it? grudznick’s close personal friend Lar was asking me.