Kristi Noem is too busy running from debates but for Governor to join the 47 members of the House on the Farm Bill conference committee. But the Daily Yonder notes that the Congress critters who do think that conference committee merits their time have a lot at stake—i.e., folks back home depending on the benefits of the Farm Bill:
In the House, conference committee members represent an aggregate of 1.7 million SNAP households with $6.7 billion in economic benefits. The conferees also represent almost 300,000 farms that receive government payments totaling $2.6 billion. The nine Senate conferees represent 3.9 million SNAP households with $7.25 billion in benefits, and 273,000 farmers who received $2.8 billion in payments [Bryce Oates and Tim Marema, “Districts of House Negotiators Get $9.3 Billion in Farm and Food Aid,” Daily Yonder, 2018.08.21].
On a per-beneficiary basis, SNAP recipients in the conferees’ districts each get an average of $2,491 to help them buy food. Each farm welfare recipient gets $9,424 to grow that food.
Daily Yonder also provides maps showing why the Farm Bill will never pass without cross-regional cooperation:
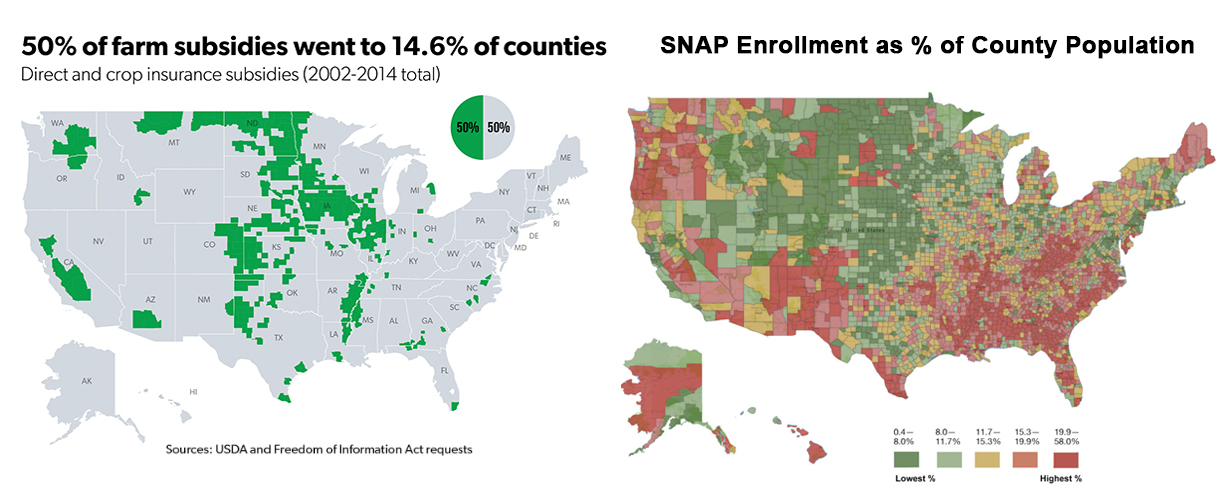
The highest concentrations of food-grower welfare are in places with some of the lowest rates of food-eater welfare. If you want national policy that supports farmers, you have to include provisions that support consumers.
But, like debates, building such coalitions across regional and party lines is just too complicated for Kristi Noem.
Slightly OT- I talked with Neighbor’s SIL who was working on fall harvesting equipment. He says this week alone soybeans have lost 35 cents per bushel. Moar drumpf winning.